Our Dashboard Designing and Development services transform raw data into meaningful insights with user-centric designs and innovative technology. We specialize in information architecture design, ensuring structured and intuitive dashboards that enhance decision-making. Our expertise spans both web and mobile app dashboards, creating tailored solutions that meet the dynamic needs of businesses. With a strong focus on data visualization and accessibility compliance, we build dashboards that are not only visually engaging but also inclusive and functional, empowering businesses to access critical information effortlessly.
By combining interactive storyboards and compelling infographics, we deliver dashboards that provide a clear narrative for complex data. Our end-to-end approach takes your ideas from concept to creation, delivering precise and actionable insights. With concise designs and a commitment to clarity, our dashboards bring data to life, ensuring decision-makers are equipped with tools that streamline operations, improve performance, and drive growth.
Service FAQs
- Can you design dashboards that integrate with my existing systems?
-
Yes, we specialize in creating dashboards that seamlessly integrate with your existing systems, including CRMs, ERPs, databases, and third-party applications. This ensures a unified and streamlined data experience.
- What types of dashboards do you develop?
-
We design various types of dashboards, including operational, analytical, and strategic dashboards. Each is tailored to specific needs, such as monitoring daily operations, analyzing complex data sets, or tracking long-term performance metrics.
- How customizable are your dashboards?
-
Our dashboards are fully customizable to align with your business requirements. From layout and design to data sources and KPIs, we ensure every element meets your specific needs.
- What tools and technologies do you use for dashboard development?
-
We utilize a range of tools and technologies, including Power BI, Airtable, and custom-built solutions, to deliver robust and intuitive dashboards that provide actionable insights.
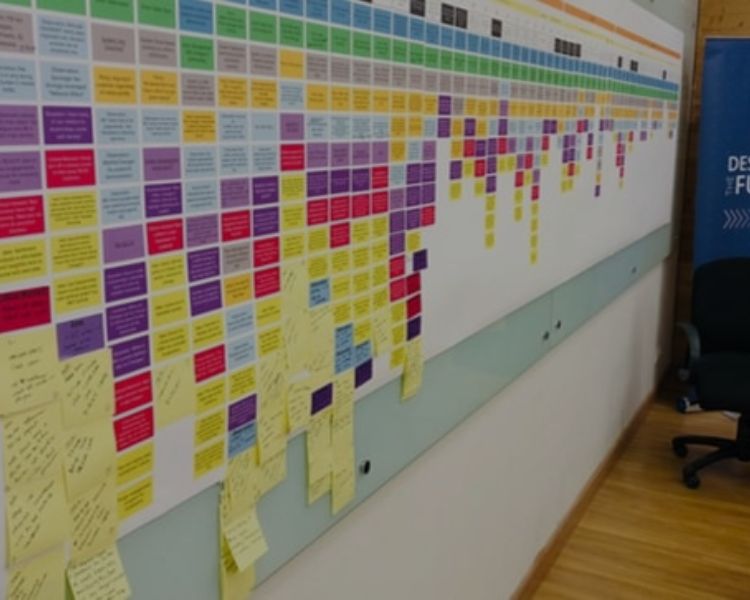
Information architecture design
We create structured frameworks that make dashboards intuitive and easy to navigate, enabling users to access the right information quickly. By organizing data logically, we enhance usability and ensure seamless interactions across all dashboard functionalities.
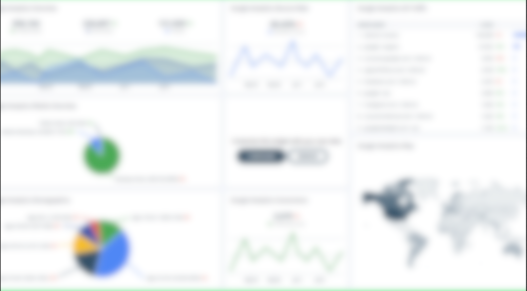
Data Visualization
Transform complex datasets into visually compelling graphs, charts, and infographics that highlight key insights effectively. Our data visualization techniques make patterns and trends clear, supporting faster and better-informed decision-making.
Accessibility Compliance
We ensure dashboards meet global accessibility standards, making them usable for individuals with diverse needs. This includes optimized layouts, assistive technologies, and user-friendly designs for an inclusive digital experience.
Web App Dashboards
Our web app dashboards are designed to deliver real-time data insights with responsive layouts and intuitive interfaces. They are fully optimized for cross-browser compatibility, ensuring seamless performance on any device.
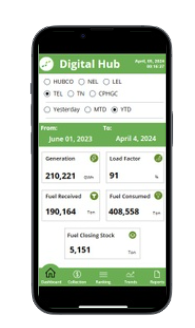
Mobile App Dashboards
We specialize in mobile-friendly dashboards that deliver key metrics and analytics on the go. Designed for scalability and responsiveness, these dashboards provide a consistent user experience across devices.
Service Benefits
Our dashboard solutions go beyond aesthetics, providing actionable insights and enhancing decision-making processes. By transforming raw data into clear and impactful visualizations, we empower businesses to unlock their full potential.
We transform initial ideas into fully functional dashboards, ensuring every detail aligns with your business goals and user needs.
Our dashboards incorporate dynamic storyboards that guide users through data insights interactively and engagingly.
We present complex data in streamlined infographics that are visually appealing and easy to understand.
Our dashboards provide precise and transparent visual representations of data, making it simple to identify trends and drive decisions.